FORGEBOX Enterprise 🚀 - Take your ColdFusion (CFML) Development to Modern Times! Learn More...

ColdBox Debugger

v4.1.0+3 Modules

Latest Stable Version Build Status License

Welcome To The ColdBox Debugger Module

The ColdBox Debugger module is a light-weight performance monitor and profiling tool for ColdBox applications. It can generate a nice debugging panel on every rendered page or a dedicated visualizer to make your ColdBox application development nicer, funner and greater! Yes, funner is a word!

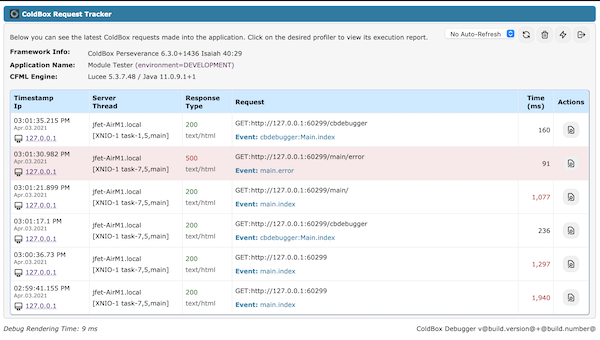
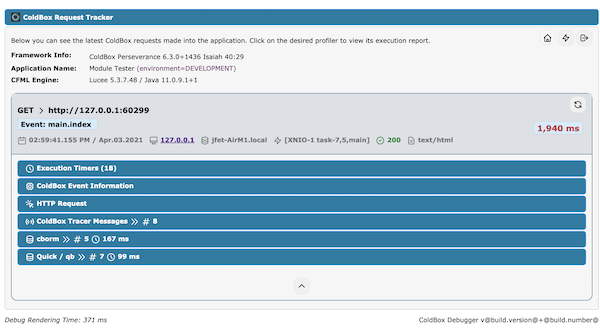
Debugger Request Visualizer


Request Tracker Collapsed

Capabilities

The ColdBox debugger is a light-weigth performance monitor and profiler for your ColdBox applications. It tracks your requests, whether Ajax, traditional or REST, it's environment, execution and much more. Here is a listing of some of the capabilities you get with the ColdBox Debugger:

  • Track all incoming requests to your applications in memory or offloaded cache
  • Track exceptions and execution environment
  • Track incoming http requests, parameters, body and much more
  • Track final request collections
  • Track Hibernate and cborm queries, criteria queries and session stats
  • Track qb and quick queries, entities and stats
  • Tap into LogBox via our Tracer messages and discover logging on a per request basis
  • Profile execution and results of ANY model object
  • Profile execution of ANY ColdBox interception point
  • Custom Timer helpers for adding timing methods and annotations anywhere in your code
  • Profile your production or development apps with ease
  • Track ColdBox modules and lifecycles
  • Highly configurable
  • Highly extensible
  • Track Adobe ColdFusion Queries (ColdFusion 2018+)

License

Apache License, Version 2.0.

System Requirements

  • Lucee 5+
  • ColdFusion 2018+
  • ColdBox 6+

Optional Requirements

cborm Collector

  • Hibernate extension (on Lucee)
  • orm package on ACF 2021

Adobe SQL Collector

  • cbdebugger package on ACF 2021
    • Check Database Activity on the debugger page or cfconfig setting (debuggingShowDatabase : true)

Instructions

Just drop into your modules folder or use CommandBox to install

box install cbdebugger

This will activate the debugger in your application and render out at the end of a request or by visiting the debugger request tracker visualizer at /cbdebugger.

Settings

The debugger is highly configurable and we have tons of settings to assist you in your development adventures and also in your performance tuning. Please note that the more collectors you activate, the slower your application can become. By default we have pre-selected defaults which add neglible performance to your applications.

Open your config/coldbox.cfc configuration object and add into the moduleSettings the cbDebugger key with the following options:

moduleSettings = {
	// Debugger Settings
	cbDebugger = {
		// Master switch to enable/disable request tracking into storage facilities.
		enabled : true,
		// Turn the debugger UI on/off by default. You can always enable it via the URL using your debug password
		// Please note that this is not the same as the master switch above
		// The debug mode can be false and the debugger will still collect request tracking
		debugMode : true,
		// The URL password to use to activate it on demand
		debugPassword  : "cb:null",
		// This flag enables/disables the end of request debugger panel docked to the bottom of the page.
		// If you disable it, then the only way to visualize the debugger is via the `/cbdebugger` endpoint
		requestPanelDock : true,
		// Request Tracker Options
		requestTracker : {
			// Track all cbdebugger events, by default this is off, turn on, when actually profiling yourself :) How Meta!
			trackDebuggerEvents          : false,
			// Store the request profilers in heap memory or in cachebox, default is memory. Options are: memory, cachebox
			storage                      : "memory",
			// Which cache region to store the profilers in if storage == cachebox
			cacheName                    : "template",
			// Expand by default the tracker panel or not
			expanded                     : true,
			// Slow request threshold in milliseconds, if execution time is above it, we mark those transactions as red
			slowExecutionThreshold       : 1000,
			// How many tracking profilers to keep in stack: Default is to monitor the last 20 requests
			maxProfilers                 : 50,
			// If enabled, the debugger will monitor the creation time of CFC objects via WireBox
			profileWireBoxObjectCreation : false,
			// Profile model objects annotated with the `profile` annotation
			profileObjects               : false,
			// If enabled, will trace the results of any methods that are being profiled
			traceObjectResults           : false,
			// Profile Custom or Core interception points
			profileInterceptions         : false,
			// By default all interception events are excluded, you must include what you want to profile
			includedInterceptions        : [],
			// Control the execution timers
			executionTimers              : {
				expanded           : true,
				// Slow transaction timers in milliseconds, if execution time of the timer is above it, we mark it
				slowTimerThreshold : 250
			},
			// Control the coldbox info reporting
			coldboxInfo : { expanded : false },
			// Control the http request reporting
			httpRequest : {
				expanded        : false,
				// If enabled, we will profile HTTP Body content, disabled by default as it contains lots of data
				profileHTTPBody : false
			}
		},
		// ColdBox Tracer Appender Messages
		tracers     : { enabled : true, expanded : false },
		// Request Collections Reporting
		collections : {
			// Enable tracking
			enabled      : false,
			// Expanded panel or not
			expanded     : false,
			// How many rows to dump for object collections
			maxQueryRows : 50,
			// Max number to use when dumping objects via the top argument
			maxDumpTop: 5
		},
		// CacheBox Reporting
		cachebox : { enabled : false, expanded : false },
		// Modules Reporting
		modules  : { enabled : false, expanded : false },
		// Quick and QB Reporting
		qb       : {
			enabled   : true,
			expanded  : false,
			// Log the binding parameters
			logParams : true
		},
		// cborm Reporting
		cborm : {
			enabled   : false,
			expanded  : false,
			// Log the binding parameters (requires CBORM 3.2.0+)
			logParams : true
		},
  		// Adobe ColdFusion SQL Collector
 		acfSql : {
			enabled   : true,
			expanded  : false,
			// Log the binding parameters
			logParams : true
		},
		// Async Manager Reporting
		async : {
			enabled : true,
			expanded : false
		}
	}
}

WireBox Mappings

The module will also register the following model objects for you:

  • debuggerService@cbdebugger
  • timer@cbdebugger

The DebuggerService can be used a-la-carte for your debugging purposes.

The Timer object will allow you to time code execution and send the results to the debugger panel.

Helper Mixins

This module will also register a few methods in all your handlers/interceptors/layouts and views. You can use them for turning the debugger panel on/off, timing code execution and much more.

	/**
	 * Method to turn on the rendering of the debug panel on a request
	 */
	any function showDebugger()

	/**
	 * Method to turn off the rendering of the debug panel on a request
	 */
	any function hideDebugger()

	/**
	 * See if the debugger will be rendering or not
	 */
	boolean function isDebuggerRendering()

	/**
	 * Start a timer with a tracking label
	 *
	 * @label The tracking label to register
	 *
	 * @return A unique tracking hash you must use to stop the timer
	 */
	function startCBTimer( required label )

	/**
	 * End a code timer with a tracking hash. If the tracking hash is not tracked we ignore it
	 *
	 * @labelHash The timer label hash to stop
	 */
	function stopCBTimer( required labelHash )

	/**
	 * Time the execution of the passed closure that we will execution for you
	 *
	 * @label The label to use as a timer label
	 * @closure The target to execute and time
	 */
	function cbTimeIt( required label, required closure )

	/**
	 * Shortcut to get a reference to the ColdBox Debugger Service
	 */
	function getCBDebugger()

	/**
	 * Push a new tracer into the debugger. This comes from LogBox, so we follow
	 * the same patterns
	 *
	 * @message The message to trace
	 * @severity The severity of the message
	 * @category The tracking category the message came from
	 * @timestamp The timestamp of the message
	 * @extraInfo Extra info to store in the tracer
	 */
	DebuggerService function cbTracer(
		required message,
		severity  = "info",
		category  = "",
		timestamp = now(),
		extraInfo = ""
	)

Timer Delegate

We have included a ColdBox 7 Timer delegate: TimerDelegate@cbDebguger that can add timing capabilities to any CFC

component delegates="TimerDelegate@cbDebguger"{

...
	startCBTimer();
	stopCBTimer();
	timeIt();
...

}

Debugger Events

The debugger also announces several events that you can listen to and extend the debugging and profiling capabilities:

// Before the debugger panel is rendered
"beforeDebuggerPanel",
// After the last debugger panel is rendered
"afterDebuggerPanel",
// Before any individual profiler report panels are rendered
"beforeProfilerReportPanels",
// After any individual profiler report panels are rendered
"afterProfilerReportPanels",
// When the request tracker has been created and placed in request scope
"onDebuggerRequestTrackerCreation",
// Before the request tracker is saved in the profiler, last chance to influence the recording
"onDebuggerProfilerRecording"

Profiling Objects

The ColdBox debugger allows you to profile the execution of ANY method in ANY CFC via our AOP pointcuts. All you need to do is add the profile annotation to a method or component declaration in your model/orm objects. Once you do, the debugger will track the execution of those methods in the debug timers panel for you. First thing to do is make sure the setting is turned on:

requestTracker : {
	// Profile model objects annotated with the `profile` annotation
	profileObjects               : true,
	// If enabled, will trace the results of any methods that are being profiled
	traceObjectResults           : false,
}

The traceObjectResults if true will track the actual results of the method calls into your debugger timer panel. Careful, as we will serialize anything you send to us. Then add the profile annotation to any method or cfc.

/**
 * Profile all methods in this component
 */
component profile{

}

// Add the profile to this method to track it
function saveAllObjects() profile{

}

Profiling objects is great because you can just annotate and forget. Nothing to turn off in production.

WireBox Object Creation Profiling

There will be cases where you need to test the performance of the creation of certain objects in WireBox. You can do so by activating the profileWireBoxObjectCreation setting in the requestTracker. Once enabled, you will see the profiling of all objects created by WireBox in the debug timers.

Profiling Interceptions

Debug Timers

In an event-driven framework like ColdBox, there are tons of events that fire within traditional request/response transactions. You can activate our tracker and we will trace and profile interception calls. Activate it via the settings first:

// Profile Custom or Core interception points
profileInterceptions         : true,
// By default all interception events are excluded, you must include what you want to profile
includedInterceptions        : [ "onUserSave", "ORMPostLoad" ],

Once activated, you can add a collection of interception points to profile in your application. We will track them for you and even if they are ORM calls we will tell you which entity initiated the call.

HTTP Request Tracking

HTTP Visualizer

The debugger will track all incoming http calls into your application. It will show you all the relevant method, query string, form params, headers, and even the HTTP Body (if enabled). By default, the HTTP Body is ignored as it can be big and tracking it on every request can reduce performance. However, you can easily turn it on and inspect the incoming packets.

requestTracker = {
	// Control the http request reporting
	httpRequest : {
		expanded        : false,
		// If enabled, we will profile HTTP Body content, disabled by default as it contains lots of data
		profileHTTPBody : true
	}
}

ColdBox Tracers

ColdBox Tracers

The debugger also ships with a LogBox appender we call the ColdBox Tracer. This tracer will absorb the usage of log info(), fatal(), error(), warn(), debug() calls within your application and group them to the request that they initiated from. You can then visualize and inspect them in your debugger. All you have to do is activate it and enjoy!

// ColdBox Tracer Appender Messages
tracers     : { enabled : true, expanded : false },

Please note that by default the tracer appender will log any logging level from fatal to debug to your request tracker and will track anything sent to it. So also note that this can have an impact on performance if you are sending tons of complex objects to the extraInfo argument. With much power, comes much responsibility!

Hibernate + cborm

Grouped cborm calls

We have a dedicated panel in the debugger that will track all criteria queries and executeQuery() calls from within your application. It will show you a grouped or a timeline visualizer of all these sql calls. All you have to do is activate it:

// cborm Reporting
cborm : {
	enabled   : true,
	expanded  : false,
	// Log the binding parameters (requires CBORM 3.2.0+)
	logParams : true
}

You can also enable logParams and we will track the original executable parameters of the query so you can debug the actual values of these executions. We will also track from WHERE in the application the sql execution came from and you can even open the file to that specific line number using our code editor integrations by clicking our open in editor buttons.

Note: CBDebugger's cborm.logParams setting requires CBORM 3.2.0 or higher.

The grouped view you see above will give you an aggregate look of all the sql calls made during the request and their frequency of execution. It will also give you a mini report of those specific sql groups with data about where the query originated from in your source code and the binding parameters, if activated.

Timeline cborm calls

The timeline view gives you a track of all the sql requests made via cborm from start to finish in your request.

qb/Quick

qb/quick calls

We have also created a qb and quick panel which will track all SQL calls made via qb or via quick during your request. We offer the same grouped or timeline visualizer for all these sql calls and even the capability to track from where the calls where made from and open them in your favorite editor to the line number. All you have to do is activate it:

// Quick and QB Reporting
qb       : {
	enabled   : true,
	expanded  : false,
	// Log the binding parameters
	logParams : true
},

Also remember that you can activate the binding parameters to the sql calls.

Adobe ColdFusion SQL Tracking

We have also created an ACF Sql panel which will track all SQL calls made during your request. We offer the same grouped or timeline visualizer for all these sql calls and even the capability to track from where the calls where made from and open them in your favorite editor to the line number. All you have to do is activate it:

// Adobe ColdFusion SQL Collector
acfSql : {
	enabled : true,
	expanded : false,
	logParams : true
},

Note: This feature works with ColdFusion 2018+ and requires the Database Activity box to be checked in the ACF Debugging & Logging page. If using ColdFusion 2021, you will need the CF debugger module installed as well. You can use the ACF CLI package manager, or the CommandBox command of cfpm install debugger. If it is not installed, install it and then restart the server before using this module.

Modules Panel

Modules Tracker

If enabled, we will track also the loaded modules in your application:

// Modules Reporting
modules  : { enabled : true, expanded : false },

From the panel you will be able to analyze the registration and activation of all your application modules. You can even reload, unload and execute life-cycle commands against them.

CacheBox Monitor

CacheBox Monitor

You can also enable the CacheBox monitor and get complete insight into all your registered application caches.

// CacheBox Reporting
cachebox : { enabled : true, expanded : false },

Debugger Visualizer

Debugger Visualizer

A part from debugging the incoming request and presenting the debugger at the end of the request, you can also navigate to /cbdebugger and visualize the Debugger request tracker. This panel will monitor ALL incoming requests to your application: rest, soap, ajax, etc.

You can execute several commands from this visualizer:

  • Clear all request history
  • Reinit ColdBox
  • Shutdown the debugger visualizer
  • Refresh the requests
  • Auto refresh the requests

You can then select a specific request and open the request report with all the tracked information.

Please note that the request tracker in the debugger has a configurable capacity for requests. By default we track the last 25 requests into the application. You can either increase it or reduce it to your hearts content. Just note that the more you track, the more memory it consumes unless you offload it to an external cache.

// How many tracking profilers to keep in stack: Default is to monitor the last 20 requests
maxProfilers                 : 25,

Storing Profilers Off-Heap

You can tell the debugger to store the profilers and instrumentation data off-heap by using the storage setting and connecting it to a distributed cache like Redis, Couchbase, Mongo, Elastic, etc. All you need to do is change the storage to cachebox and update the cacheName to point to the distributed cache name you have configured in your config/Cachebox.cfc.

storage  : "cachebox",
cacheName : "couchbase"

With that configuration, all the profiler data and instrumentation will be sent to the distributed cache.


Copyright Since 2005 ColdBox Framework by Luis Majano and Ortus Solutions, Corp www.coldbox.org | www.luismajano.com | www.ortussolutions.com


HONOR GOES TO GOD ABOVE ALL

Because of His grace, this project exists. If you don't like this, then don't read it, its not for you.

"Therefore being justified by faith, we have peace with God through our Lord Jesus Christ: By whom also we have access by faith into this grace wherein we stand, and rejoice in hope of the glory of God. And not only so, but we glory in tribulations also: knowing that tribulation worketh patience; And patience, experience; and experience, hope: And hope maketh not ashamed; because the love of God is shed abroad in our hearts by the Holy Ghost which is given unto us. ." Romans 5:5

THE DAILY BREAD

"I am the way, and the truth, and the life; no one comes to the Father, but by me (JESUS)" Jn 14:1-12

Changelog

All notable changes to this project will be documented in this file.

The format is based on Keep a Changelog, and this project adheres to Semantic Versioning.


Unreleased

4.1.0 - 2023-04-17

Added

  • New github actions
  • Donot enable debugger in testing mode

[4.0.1] => 2022-NOV-22

Fixed

  • Adobe dumb array by value

[4.0.0] => 2022-NOV-22

Added

  • ColdBox 7 support
  • New TimerDelegate that can be used to add timer functions to any model
  • Timer service rewritten to support nesting and included metadata
  • Ability to open views and layouts from the execution timers in any Code Editor
  • New WireBoxCollector which is only used if enabled. This greatly accelerates the performance of the request collector since before they where in the same collector.
  • Ability to open CFCs that are profiled by the WireBox Collector in any Code Editor.
  • Ability to open the Handler events that are profiled by the Request Collector in any Code Editor.
  • New life-cycle events: onDebuggerUnload, onDebuggerLoad
  • Ability for the custom timeIt() functions to accept metdata to store in the execution timer
  • New Slowest Queries panel for cborm, acf, and qb/quick
  • New visualizer total db time as well as request time including percentage of the request time
  • Ability to export a profiler in json
  • Ability to sort the visualizer's profilers

Fixed

  • Timer service reconstructing the timer hashes and profilers twice.
  • timeIt() helper was not passing the closure correctly
  • If doing a fwreinit on the visualizer, the current profiler was still being show even thought it was empty. Add an empty check to avoid the big bang!
  • Empty response codes for Adobe, due to their incredibly weird Response object nesting.
  • Migration to java random id's for speed

Changed

  • Tracers are now streamlined and stored alongside the request profilers
  • Small UI fixes on request profiler HTTP methods
  • WireBox collecting is now done by the WireBox collector not the Request Collector.
  • Adobe 2016 Dropped

[3.4.1] => 2022-JUL-12

Fixed

  • If the debugger is disabled or not in debug mode, the panels and visualizers are still being rendered and exploding. This should be a 404.

[3.4.0] => 2022-JUN-27

Added

  • Upgraded entire front end build process to ColdBox Elixir v4
  • Upgraded to Node 16 for all front end processes

Fixed

  • If the cbdebugger was embedded within an app already using Alpine, it will fail. Now it will leach on to the running Alpine app.

[3.3.2] => 2022-MAY-02

Fixed

  • CBDEBUGGER-19 - JSON Form serialization not working on formatting.

[3.3.1] => 2022-APR-21

Fixed

  • CBDEBUGGER-17 If you change the monitor frequency, it does not clear the old monitor and you get n monitors
  • CBDEBUGGER-16 Left double hash on no state for request tracker profiler
  • CBDEBUGGER-15 Auto-Refresh is not working in latest version
  • CBDEBUGGER-10 Executing Event That Uses QB From Interceptor Generates CBDebugger Exception
  • CBDEBUGGER-6 Stop auto-refresh when visiting a actual request report

[3.3.0] => 2022-APR-21

Added

  • Asynchronous saving of storage at end of requests
  • Asynchronous size checks of storage
  • Free memory diff in the visualizers
  • Ability for each profiler to track how much memory they used during the course of the transaction by analyzing free memory
  • New setting requestPanelDock to show/hide the request panel in the dock
  • Migration to use new module template approaches that supports github releases, compilation and more
  • Exception bean delegations in debugger service to avoid multi-instantiations performance
  • Refactoring to increase performance and reusability
  • Migration to AlpineJS from jquery
  • New sqlformatter module from @michaelborn
  • Updated to faster wasy to get a local ip and local hostname

Fixed

  • Actually show a 404 if debug mode is off
  • JS Bumps

Removed

  • Reload all modules. Makes no sense as you can just reinit.

[3.2.0] => 2021-JUL-21

Changed

  • Thanks to @homestar9 changed the elixir asset to a specific of cbdebugger.(js.css) to avoid collisions with main app.

Added

  • Adobe 2021 support and automated testing
  • Migration to github actions

[3.1.1] => 2021-JUN-05

Fixed

  • Do not render when the request's content type is NOT html

[3.1.0] => 2021-MAy-19

Fixed

  • Fix wrong cborm reference on QBCollector
  • Look at the renderdata content type instead of type as it's more consistent in order to turn off the debugger on multi-marshalled sites
  • [CBDEBUGGER-1] - Lucee debugger no longer shows below the cbDebugger. Turn off only on Ajax Calls

Changed

  • Use Java property for version to work with jdk8+
  • [CBDEBUGGER-2] - Made cborm and qb disabled by default

[3.0.0] => 2021-APR-07

Added

  • Completely rewritten debugger
  • Updated tracers to match all logbox options so we can use them for display instead of hardcoding them in the push operation
  • Complete migration to elixir for assets
  • Complete migration to runnable events to make things easier for rendering and debugging
  • New interceptor profiling via AOP announce interceptions
  • New object profiling via metadata AOP aspects via new settings: profileObjects, traceObjectResults
  • New visualizer route /cbdebugger that if you are in debug mode, you can visualize the panels. Great for API apps
  • New method: timer.timeIt() so you can time code execution via a closure wrapper
  • New Helper Methods: startCBTimer(), stopCBTimer(), cbTimeIt()
  • Added the route record to the info panel so you can debug the selected route
  • Highlights transactions that take over 200ms or using the slowExecutionThreshold setting
  • Refactored to use array of structs instead of queries for even faster timer performance

Changed

  • Encapsualted request timers UI into a single template
  • Timer is now built in script and optimized
  • Show timers as they start instead of how they end, huge UI update to visualize the timers
  • Refactored the logbox appenders from includes/appenders to appenders

Security

  • Dumpar facilities removed due to security concerns

Removed

  • Old debugger settings instead use the modulesettings.cbdebugger according to ColdBox 5+ standards
  • Old helper code to remove helpers
  • Removed the loaded modules as it just produced noise
  • Removed the rc/prc snapshot comparisons, causes too much noise and not helpful anymore

[2.2.0] => 2020-MAY-18

Added

  • Upgraded Appender to script and fixes for LogBox 6
  • More tests for logbox loading and appender registration

Fixed

  • Visual display of the debugger version

[2.1.0] => 2020-MAY-14

Added

  • ColdBox 6 support
  • Formatting

Removed

  • ColdBox 4 lingering code

[2.0.0] => 2020-MAY-04

Added

  • Formatting updates
  • Quick/QB Panels

Removed

  • Dropped ACF 11 support

[1.7.1] => 2019-MAR-06

  • Updated location protocol

[1.7.0] => 2019-MAR-06

  • Missing interception points for extending the panels: afterDebuggerPanel, beforeDebuggerPanel
  • New Module Layout
  • Dropping lucee 4.5 support

[1.6.0 ]

  • ColdBox 5 Support

[1.5.0]

  • Case-Sensitive filesystems fix
  • Updated travis builds
  • Unified workbench approach

[1.4.0]

  • ColdBox Tracer Appender added by Default by Eric Peterson

[1.3.0]

  • Travis integration
  • DocBox update
  • Build process update

[1.2.0]

  • Fix unscoped currentrow which was throwing an error when debugging was enabled.
  • Removed reference to missing images in CSS
  • Updated build scripts
  • How to turn off debugger for tests, it does this automatically now.
  • filename cases don't match #5 on certain includes

[1.1.0]

[1.0.1]

  • Bug fixes on caching panels and chicken/egg issues for ColdBox loading

[1.0.0]

  • Create first module version

$ box install cbdebugger

No collaborators yet.
     
  • {{ getFullDate("2014-09-01T17:25:19Z") }}
  • {{ getFullDate("2023-04-17T18:40:49Z") }}
  • 16,432
  • 77,810